How to Debug
The Debug tool is used to debug a Solution or part of a Solution. This is done to ensure that no errors or omissions exist within the Solution that would prevent the Solution from executing as intended and achieving the required objectives. The purpose of debugging is to test one or more Functions, services or service events using specific user-defined input values.
Debug Process
Typical Steps:
A basic debug process:
Select a Function or Event to debug.
On the main tool bar, click Debug.
View the initial Debug Output (indicating successful compilation and readiness to start debug).
Click Start (on the Debug tool bar).
View Debug Output, Debug Values and verify any output created by the Function or Event.
Click Close.
A basic stepped debug process:
Select a Function or Event to debug.
On the main tool bar, click Debug.
View the initial Debug Output (indicating successful compilation and readiness to start debug).
Right-click on a specific Function or Event of the Solution and select Add Breakpoint.
Right-click on a Function or Event of the Solution and select Enable Logging.
Click Start (on the Debug tool bar).
View Debug Output and Logs.
Click Resume to let the debugger run to the next Breakpoint, or click Step Over to let the debugger run to the next component of the solution.
View Debug Output and Logs.
Repeat step 7 and 8 as required.
View Debug Output, Debug Values and verify any output created by the Function or Event.
Click Close.
Debug a Service
- Right-click the Service and select Debug.
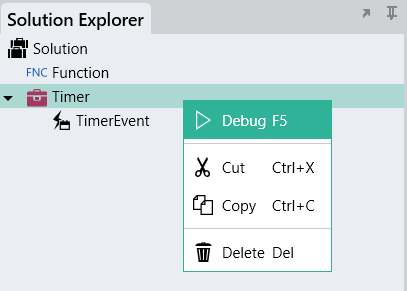
On the debugger toolbar, click Start.
The Debug Output panel will display debug progress, indicate any exceptions encountered, and where logging was enabled it would also display the logs for the different debug actions on the relevant components of the solution.
Demo Video
Debug a Function
Main Tool bar
- Debug
Click Debug on the main tool bar to prepare the Function or Event for debugging.
The Function or Event is compiled and basic validations are checked.
The Debug Tool bar opens.
If the Function or Event compiles successfully, in the Debug Output section it will indicate that the Start button should be clicked next.
Solution components
- Add Breakpoint
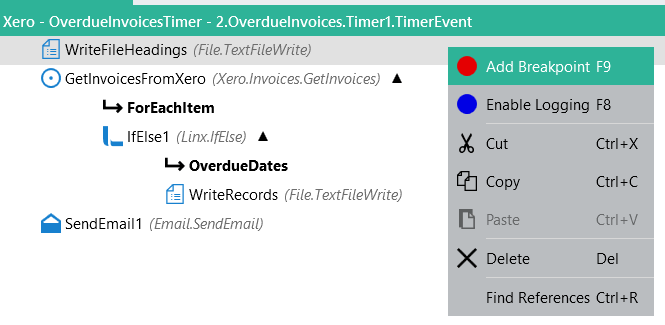
Right-click on a specific Function or Event of the Solution and select Add Breakpoint.
Adding a breakpoint enables a “stepped” debug process where the behavior of components, especially in relation to the values of variables, can be monitored or tracked. This assists in ensuring correct performance, as well as in troubleshooting any possible issues.
- Enable Logging
Right-click on any Function or Event of the Solution and select Enable Logging.
Enabling logging ensures that the Debug Output would also include all the details (logs) of the solution’s actions, and not only details on exceptions (errors).
Debug Tool bar

- Start
Click Start to commence the debug process.
- Resume
Click Resume to continue debugging. (The need to resume would be when the debugger was previously stopped, paused or in case a breakpoint was included).
- Pause
Click Pause to pause the execution of the debugging process. (To resume debugging, click Resume).
- Stop
Click Stop to stop the debugging process. (The debug process cannot be resumed; click Start to commence the process again).
- Step Over
Click Step Over to proceed to the next component of the solution that is being debugged.
- Step Into
Click Step Into to debug into another Function.
- Close
Click Close to close the Debug Tool.
Debug Output

There are 2 phases to debugging:
Compile: compiling a Function or Event and getting the debugger ready for debugging
Debug: debugging the Function or Event
For the compile phase, the Debug Output panel will display the debug status, including an indication for readiness to proceed to the next debug phase.
For the debug phase, the Debug Output panel will display debug progress, indicate any exceptions encountered, and where logging was enabled it would also display the logs for the different debug actions on all the components of the solution.
Debug Values

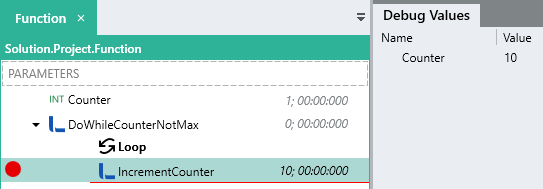
The Debug Values panel will display the values of variables as set and updated during the course of the debug process.
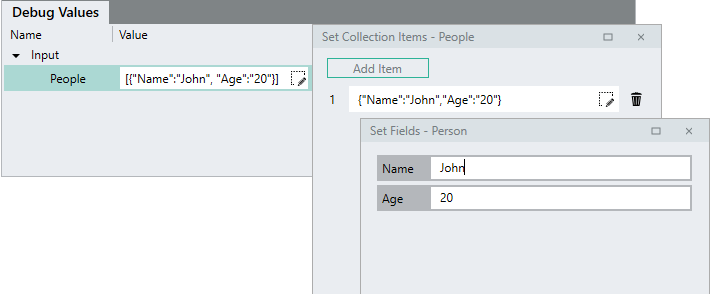
When debugging a process or event in the designer that has complex input values, you have to specify the input value as a JSON string. This can be difficult for complex types that are many levels deep. To make it easier you can use the editors that will appear on complex types. When using the editor, it will build up the appropriate JSON string for you. You do still have the option of entering the string manually.
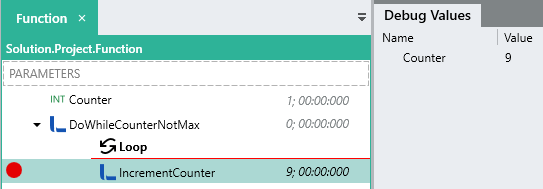
To inspect the state of the debug values after the last function in a loop has executed, you can step to the end of a loop or past the last function. You will see that the debugging location indicator (the red line) moves past the last function and allow you to inspect the relevant debug values.
Call Stack
While debugging your function/service/event in the Linx designer, a call stack of the currently executing functions will be displayed, with the latest function at the top. You can navigate to the relevant function listed in the call stack by double-clicking on the relevant entry.

Analyzing Logs
Logs are records of all the actions or events of a solution during its execution. Logs could be generated as part of the debug process to enable confirmation of the successful and expected completion of all tasks within the solution. Analyzing logs could also form an important part of the troubleshooting process to find the causes for incorrect or unexpected solution behavior. During debugging "logs" are only visible in the Debug Output section.
