
Linx Server User Interface
Below is a typical display of Linx Application Server after successful login:
Menu bar
The menu bar at the top of the screen has 3 menu options:
Overview
Click on Overview to display a detailed list of all Solutions.
Select a Solution from the list to proceed to the Solution Dashboard, from where specific actions can be performed on the solution or any of its associated components.
Server
Click on Server to view a menu of options related to managing the server:
- Upload Solutions
Click on Upload Solutions to upload a new or updated solution to Linx Application Server.
Either select the solution file or drag and drop the file onto the Add / Update Solutions canvas, and then click Upload.
- Users
Click on Users to view a list of users.
To update a user’s password, click Edit.
To delete a user, click Delete.
To add a new user, click the Add button and provide the following details:
- Name
- Password
- License
Click on License to view the details of your license.
To update your Linx license, click the Update License button.
- Resources
Click on Resources to view a breakdown of the resource usage for each Solution, indicating CPU and memory (RAM).
- Server Log
Click on Server Log to view logs for all activities related to server installation and updates.
- Host Log
Click on Host Log to view logs for all activities related to deployed solutions.
- Linx Updates
Click on Linx Updates to view the Linx version details and to see if there are available updates.
- Logout
Click to log out of Linx Application Server.
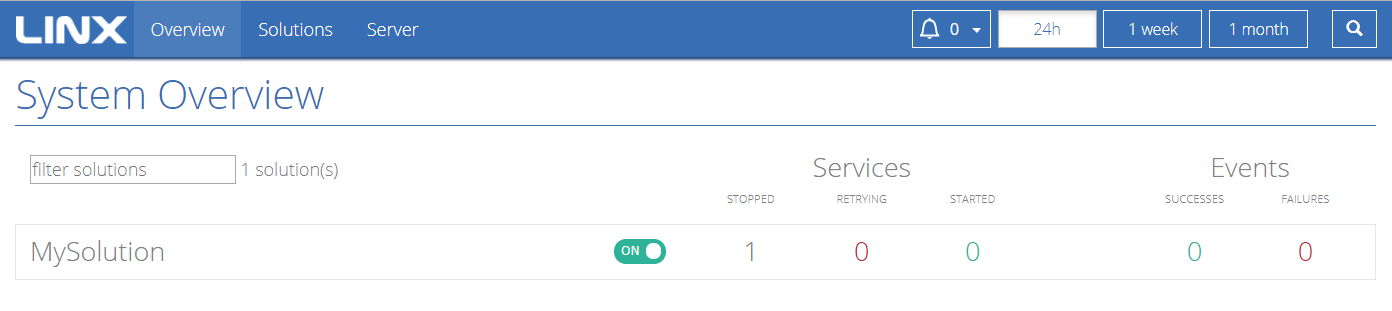
System Overview screen
The System Overview screen is the default screen displayed when opening Linx Application Server. It can also be accessed by clicking on the top menu bar’s Overview option.
Displayed on the System Overview screen is a list of Solutions that have been deployed to Linx Server.
For each Solution there is an indication of:
- Whether the Solution is On or Off.
- The number of services that are in any of the 3 different states – Stopped, Retrying and Started.
- The number of Successes and Failures for executed Events.
Click on a Solution to access the Solution Dashboard, which provides more details about the solution and its components.
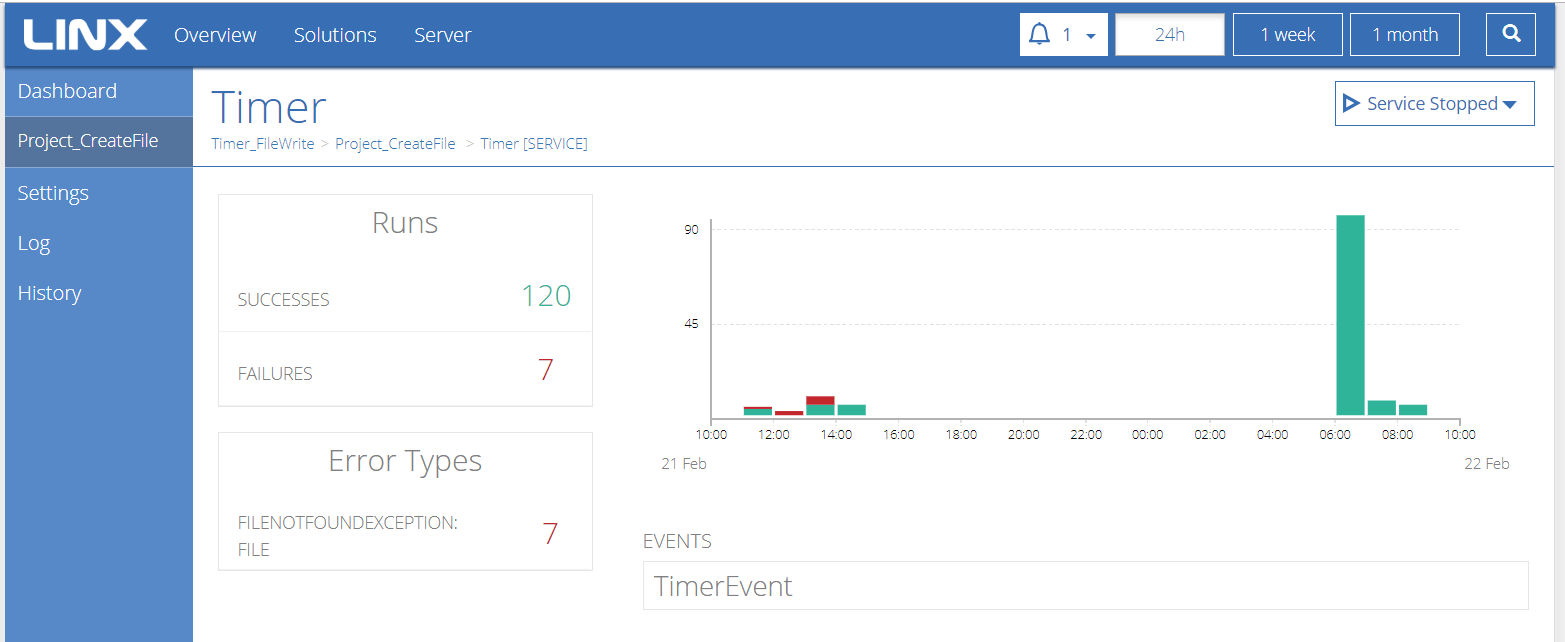
Solution Dashboard
To access a Solution Dashboard, select the relevant solution from the System Overview screen.
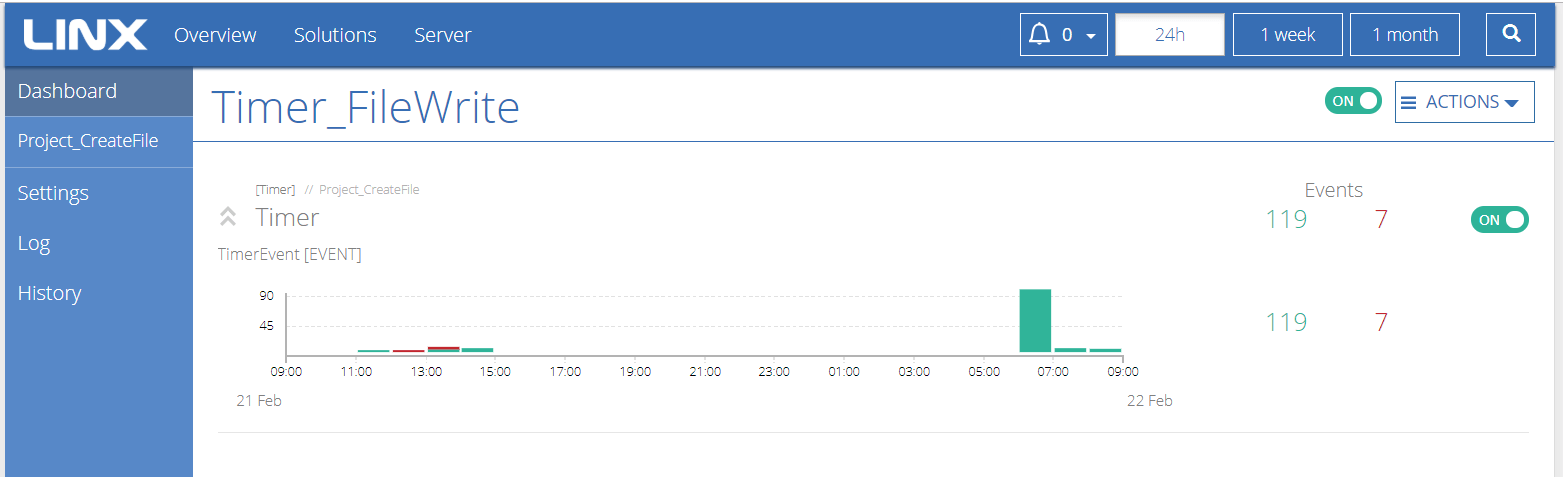
The Solution Dashboard provides:
- A view of the main Solution components with the ability to drill down into components for more detail.
- The ability to monitor the state of the Solution and its associated Services and Events.
- A quick way of taking specific action on the Solution, Services and Events.
Name of the Solution
Confirmation of the selected Solution to which the Dashboard applies.
Actions drop-down
From here the following actions can be performed on the Solution:
- Restart Solution
- Download Solution
- Remove Solution
List of Services
In the center of the display is a list of Services with:
- The name of the Service.
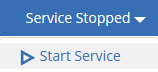
- An indication of the Service state (On or Off) - click the button to change the current state.
- A list of associated Events.
- Event counters, indicating the number of times an Event has executed successfully and the number of times it has failed (based on the user’s selection of date range, located at the top of the screen).
- A graph indicating the dates and times when the event was successfully and unsuccessfully executed. Click on a graph bar for more details of the event execution. (To see specific error details, select the relevant project from the menu on the left of the screen, then click through to the event details screen.)
Date range options
To filter the counter and graph displays, use the date range options at the top of the screen.
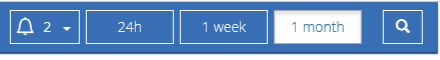
The date range options are: - the last 24 hours - the last week - the last month
Project
To access the Project screen, select the relevant solution from the System Overview screen, then select the project from the menu on the left.
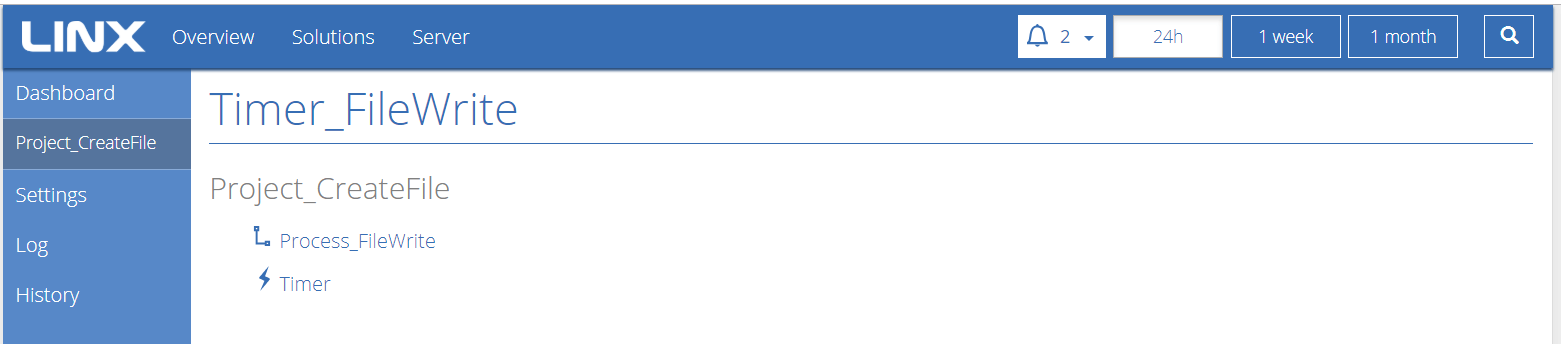
A list of the project’s executable components (Functions and Services) are displayed.
Select a component to view the number of successes, failures and specific error types related to the execution of that component.
If the component is a Function, click the Run Function button to execute.
If the component is a Service, click the Start Service button for your Service events to execute as per your Service and event settings.
To run an Event manually, or to view Event details, select the relevant Event.
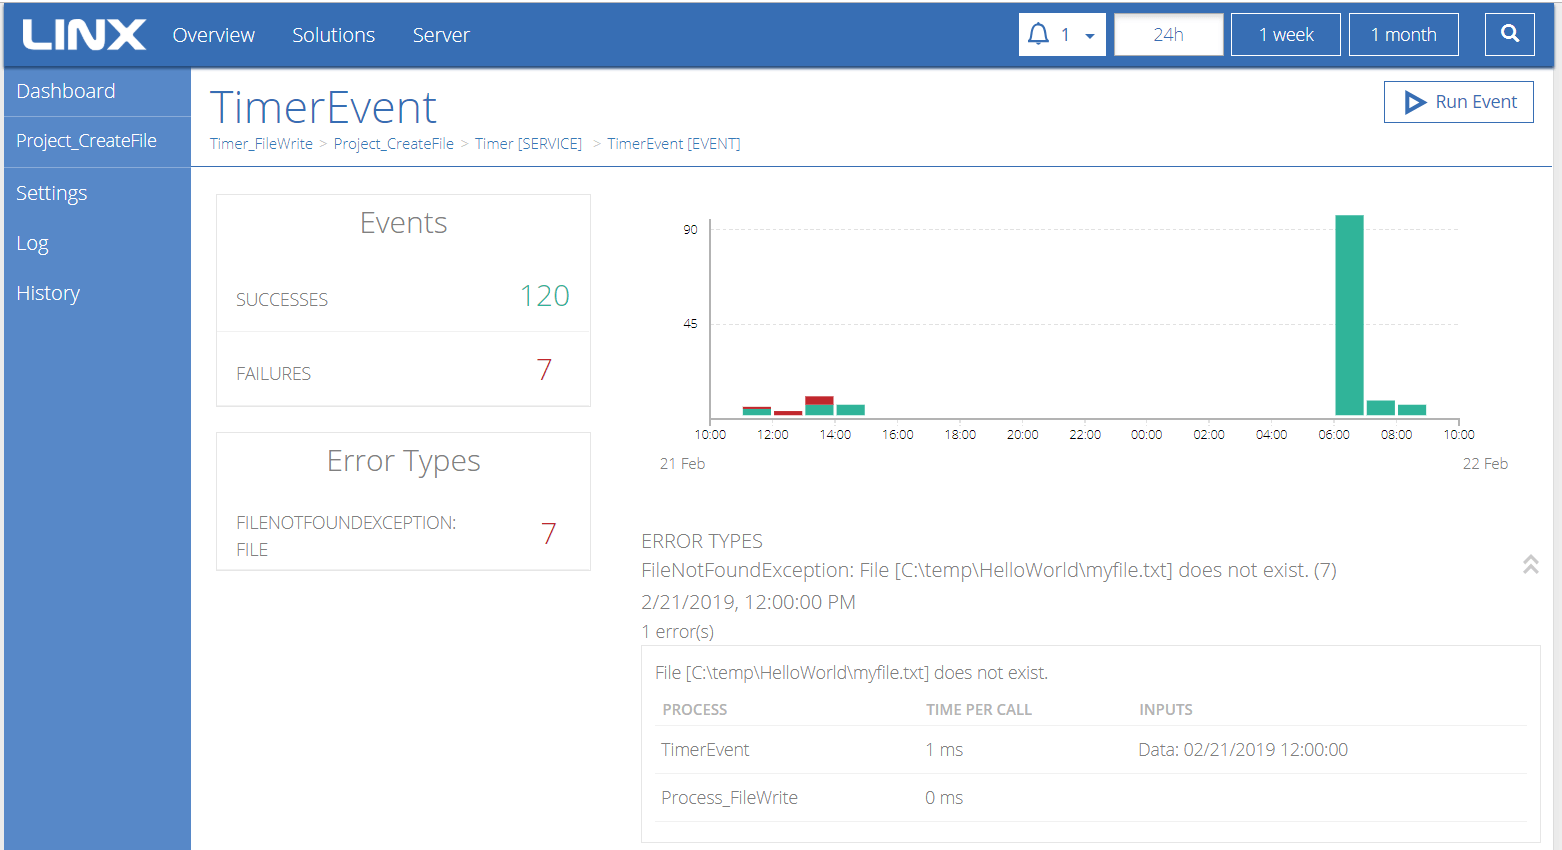
To run an Event, click the Run Event button at the top.
To view error details, click on an error type listed in the Error Types section.
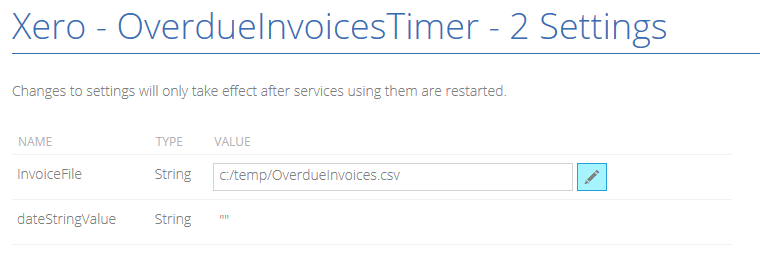
Settings
To access the Settings screen, select the relevant solution from the System Overview screen, then select Settings from the menu on the left.
The Settings that were configured on Linx Application Designer during the design of the Solution can be edited on Linx Application Server.
An example view of the Settings in Linx Application Designer:
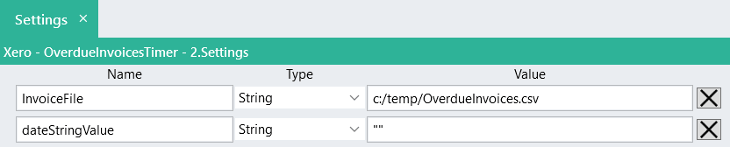
A view of the same Settings on Linx Application Server:
Log
To access the Log screen, select the relevant solution from the System Overview screen, then select Log from the menu on the left.
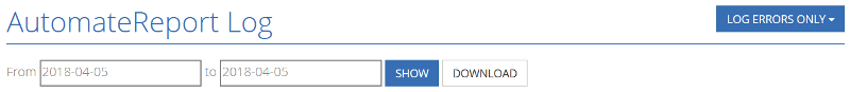
Complete logs of activities related to the Solution are available to view and download.
To retrieve logs, select a date range and click either the Show button or the Download button.
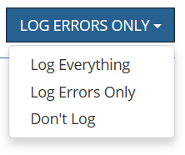
To set the logging instructions of the solution, click on the drop-down and select from the available options:
History
To access the History screen, select the relevant solution from the System Overview screen, then select History from the menu on the left.
The history of the Solution’s deployment and subsequent updates are displayed.
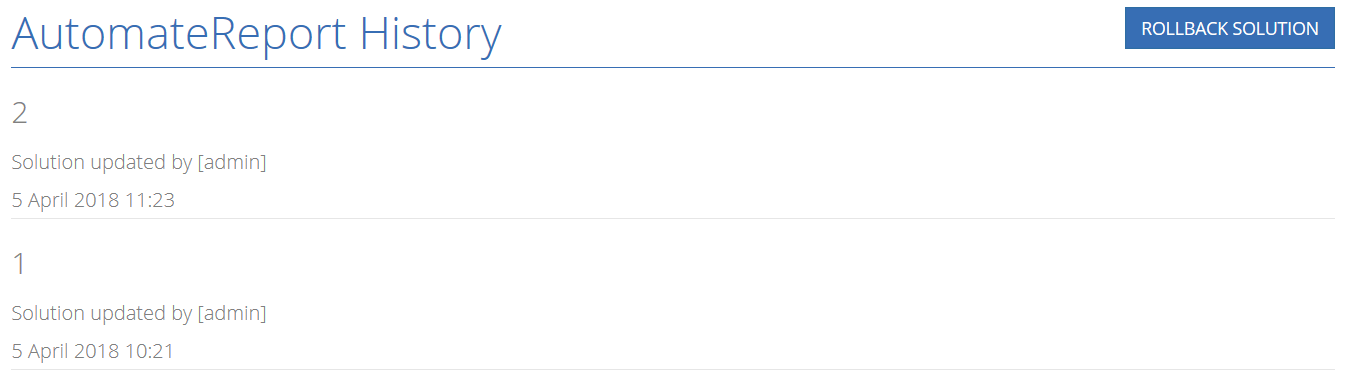
Click the Rollback Solution button to perform a rollback to the previous version of the solution.