
Quick Start
The following is a step-by-step description of the typical actions required to deploy and set up a fully functional, automated solution:
Step 1: Deploy a Solution
There are 2 ways in which a Solution can be deployed to Linx Application Server:
i) Deploy from Linx Application Designer
ii) Upload from Linx Application Server
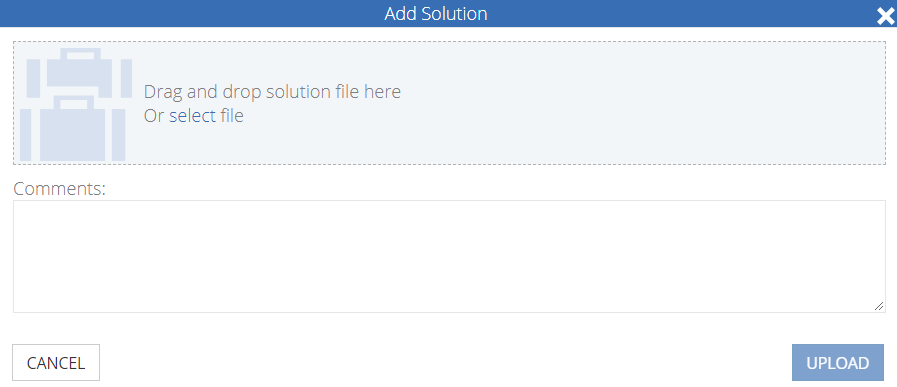
After logging in to Linx Application Server, on the menu bar, click Server and then click Upload Solutions.
Either select the solution file or drag and drop the file onto the Add / Update Solutions canvas, and then click Upload.
You can then edit the Settings that were defined in Linx Application Designer.
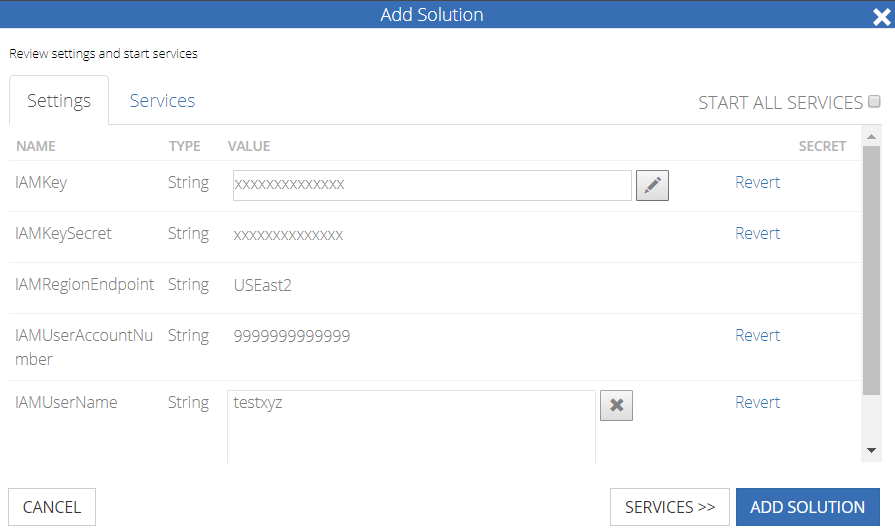
You can also indicate which Services to start (all or selected services).
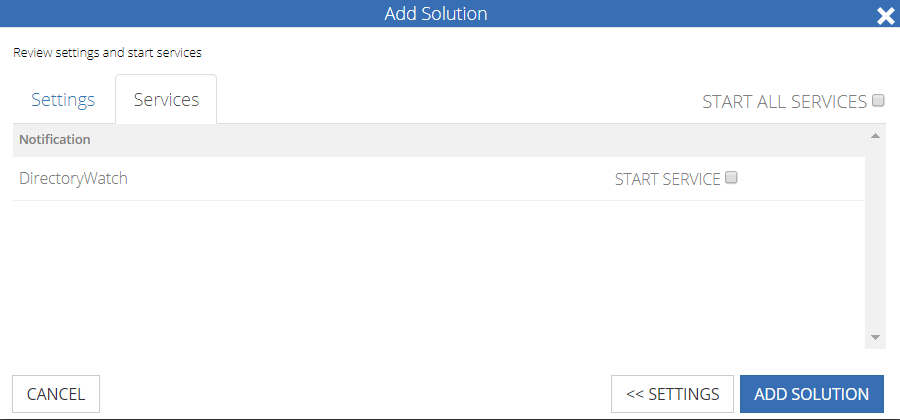
Click the Add Solution button to finalise the deployment of your Solution.
 Video Demo
Upload a Solution
Step 2: Access the deployed Solution
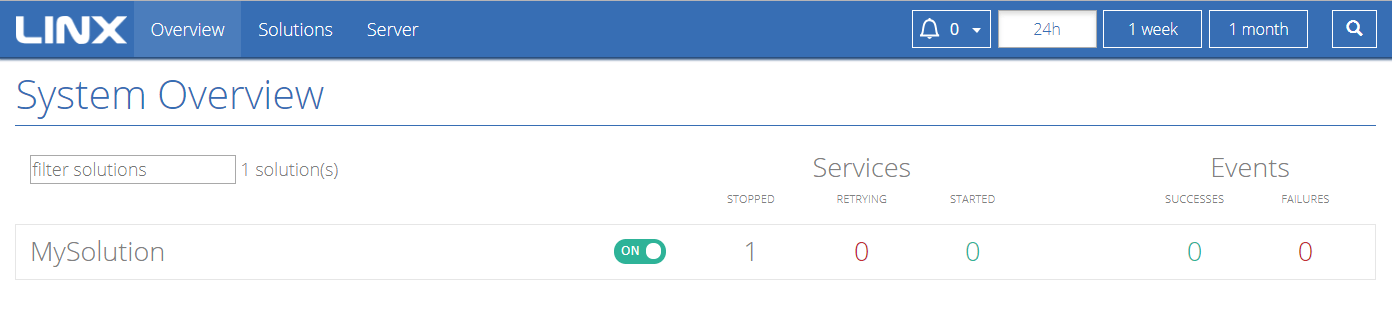
After successful login and deployment/ uploading of your Solution, the System Overview screen is displayed, listing your Solution.
If you uploaded your Solution from within Linx Server, you may already have started your solution's Services, as per the previous step.
If required, start your Solution manually:
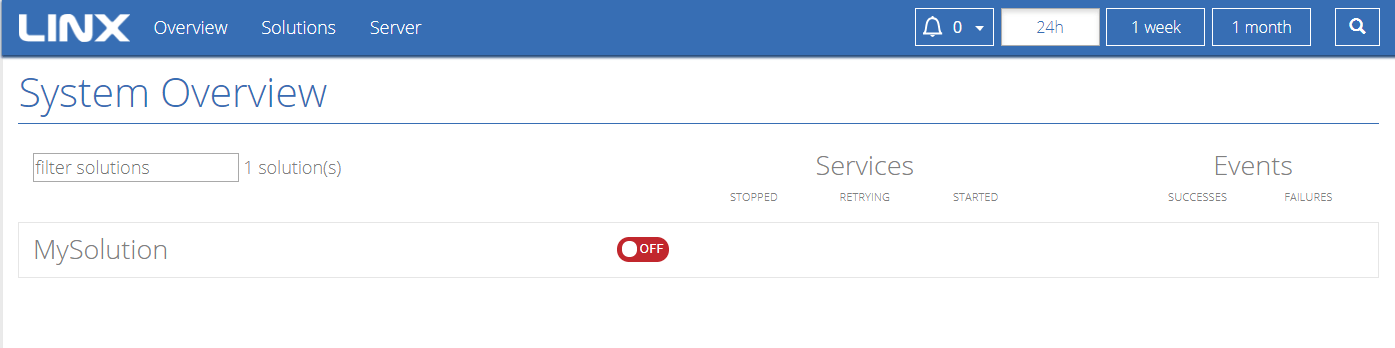
On the System Overview screen, click on your solution's On/Off button to start your Solution.
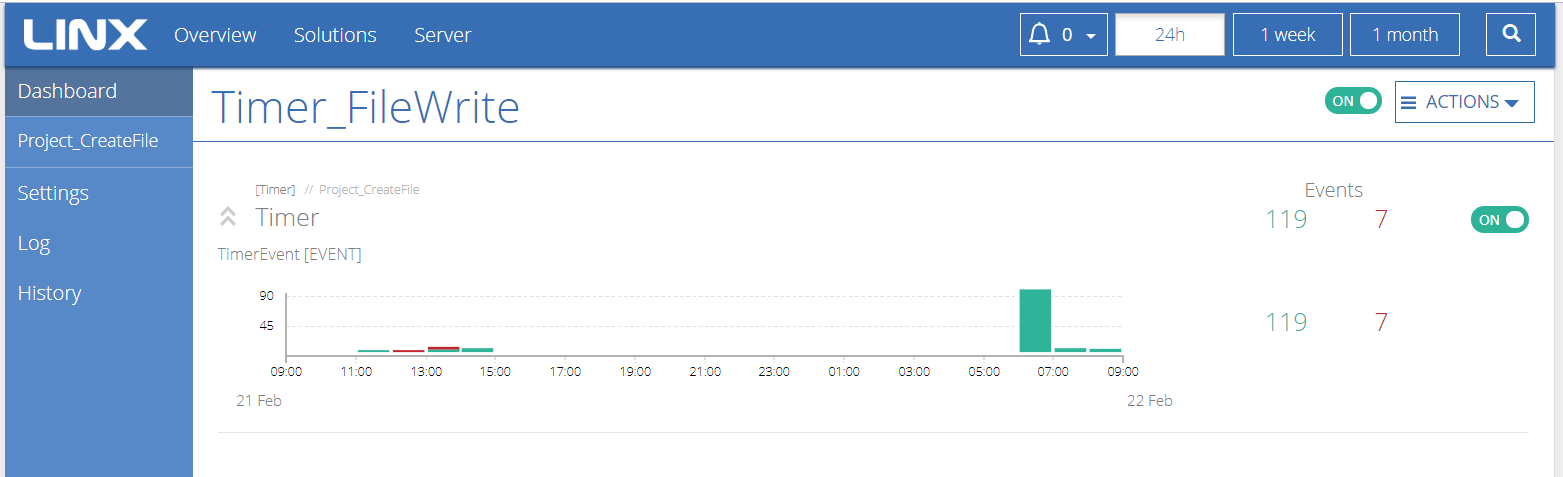
When a Solution has been started, click on the Solution to proceed to the Solution Dashboard screen.
Step 3: Start a Service
On the Solution Dashboard screen, click the Start button for the service you want to execute.
Video Demo
Start a Service
Step 4: Verify event execution and results
To verify the success of your automated solution, check the following:
Verify execution status:
On the Solution Dashboard screen, the service should indicate “Started”. Also, in the Services section, the newly started service should be reflected by the incremented value of the “Started” counter.
Verify execution result:
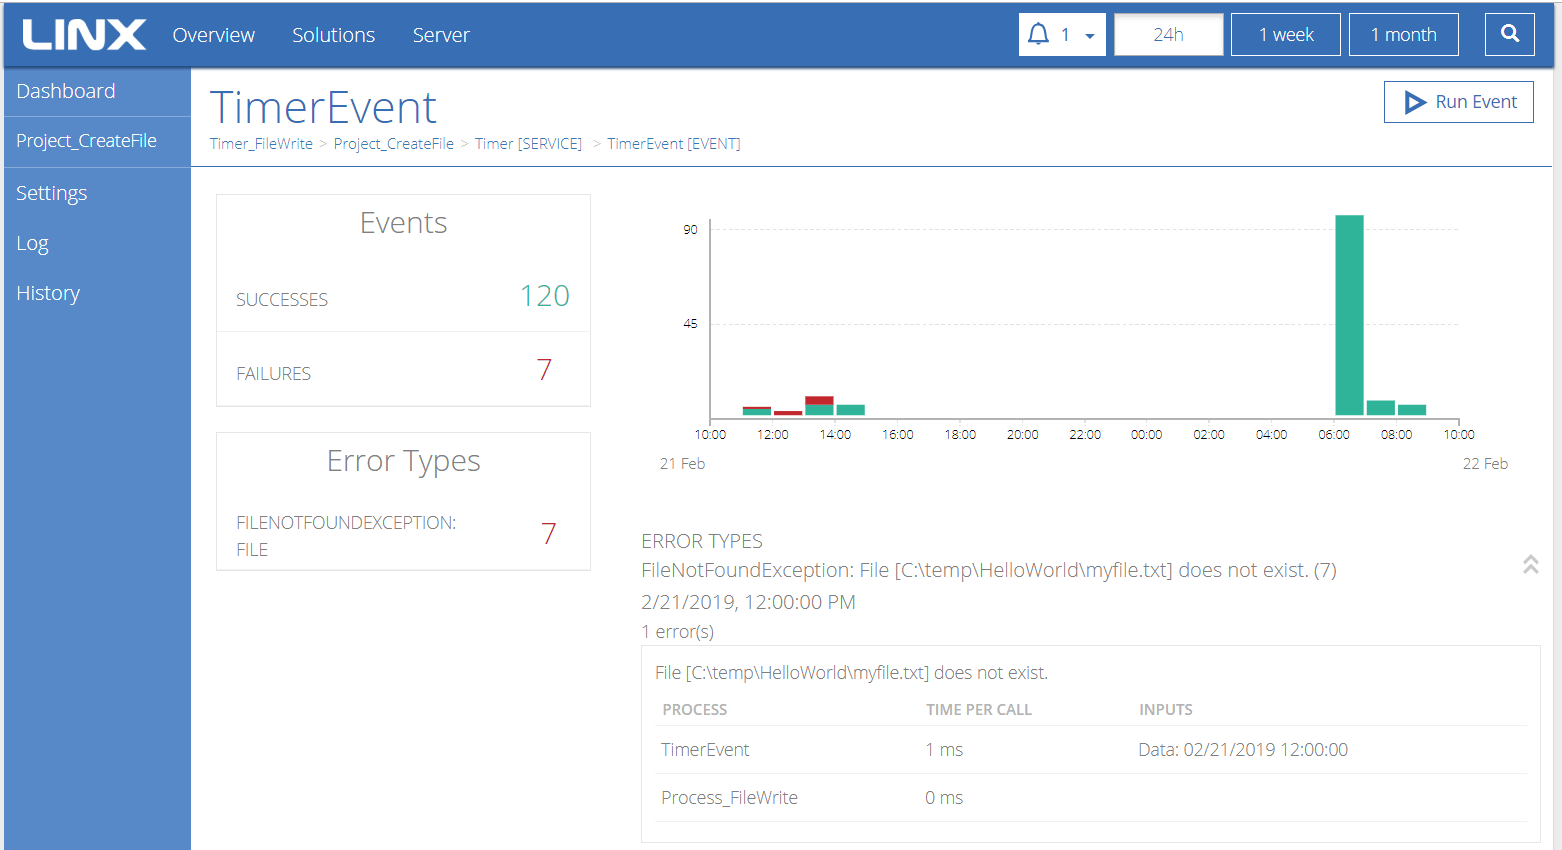
On completion of the service’s execution, in the Events section the result should be reflected under either “Successes” or “Failures”.
In case of Failure, the Error Types section will display brief details of the error that caused the event to fail.
For more details on the error, follow these steps: - Select a date range at the top of the screen.
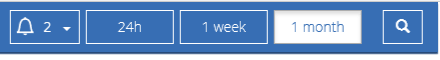
Note: The date range options are for: the last 24 hours, last week and the last month.
- Select your project from the menu on the left, then click on the relevant Service.
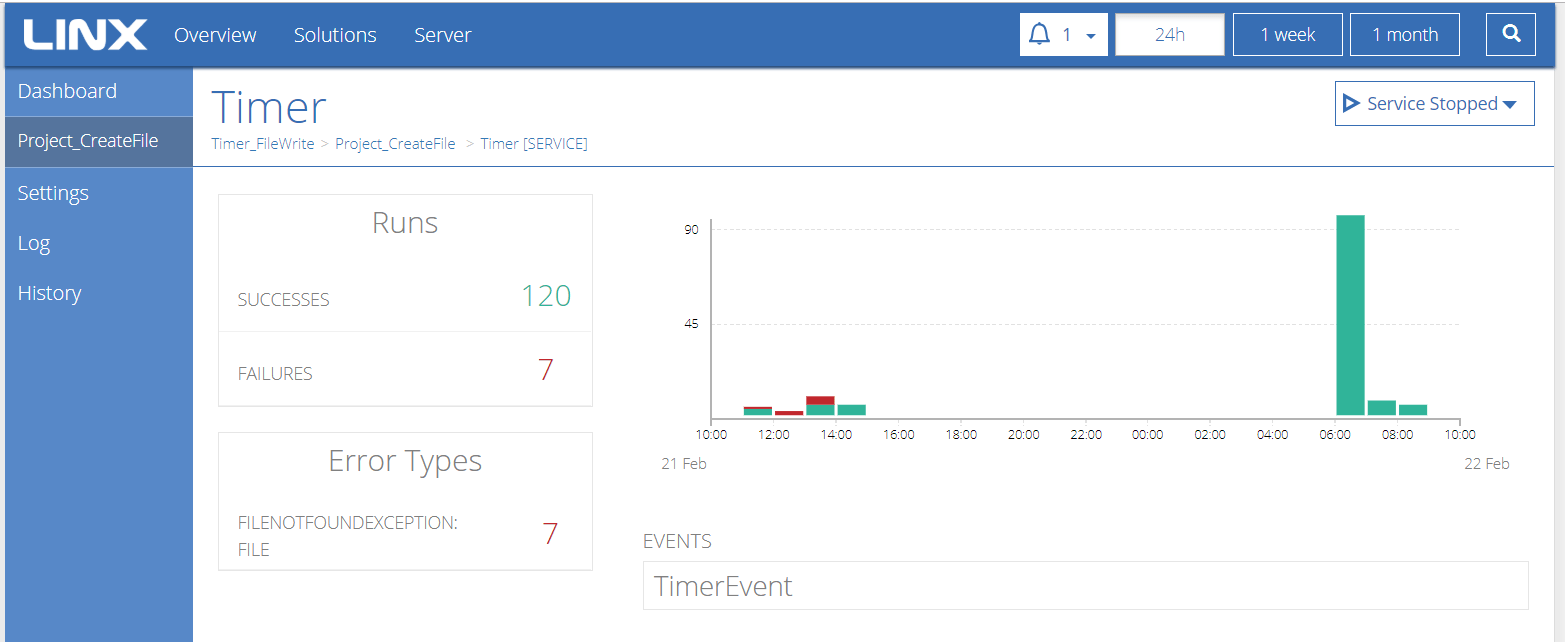
- On the next screen click on the Event.
- Finally, click on the Error Type.
The details of all the errors that are relevant to the date range will display. To view details of specific errors, click on the error where it is displayed on the graph.
Verify execution output:
In case an event executed successfully the actual output of the event (e.g. file, email, etc) could also be verified.