For the day-to-day developer, deployment and hosting, plus the subsequent management of solutions in production, is a considerable challenge, especially if it’s outside their immediate skill set.
Hosting applications can be complex. Besides the obvious challenges of scalability, security, and reliability (up-time), you must consider where your application will be hosted, how you plan to deploy it, how to monitor it, and more. Overall, effective application hosting requires careful planning, ongoing management, and a deep understanding of your application stack, hosting environment, and security risks – and low-code platforms often solve this need.
Hosting with Linx
The Linx Server can be compared to a .Net Application Server with built-in monitoring and configuration. The Server hosts Linx solutions – and runs the services therein- that have been built and debugged in the Linx Designer. Solutions are deployed to Linx Server from within Linx Designer or uploaded from the Linx Server management console.

Linx server is designed to make deployment and hosting quick, simple, and efficient. There is no need for complex deployment pipelines, various services, and other mechanisms, allowing for rapid design to production.
Linx Server Overview
Linx Server is a Windows-based application server. It can be hosted in the cloud, private cloud or on-premise. The Server manages:
- Linx Applications and their Services
- Users
- Configuration
- Logging
- Metrics
- Updates
- Resources
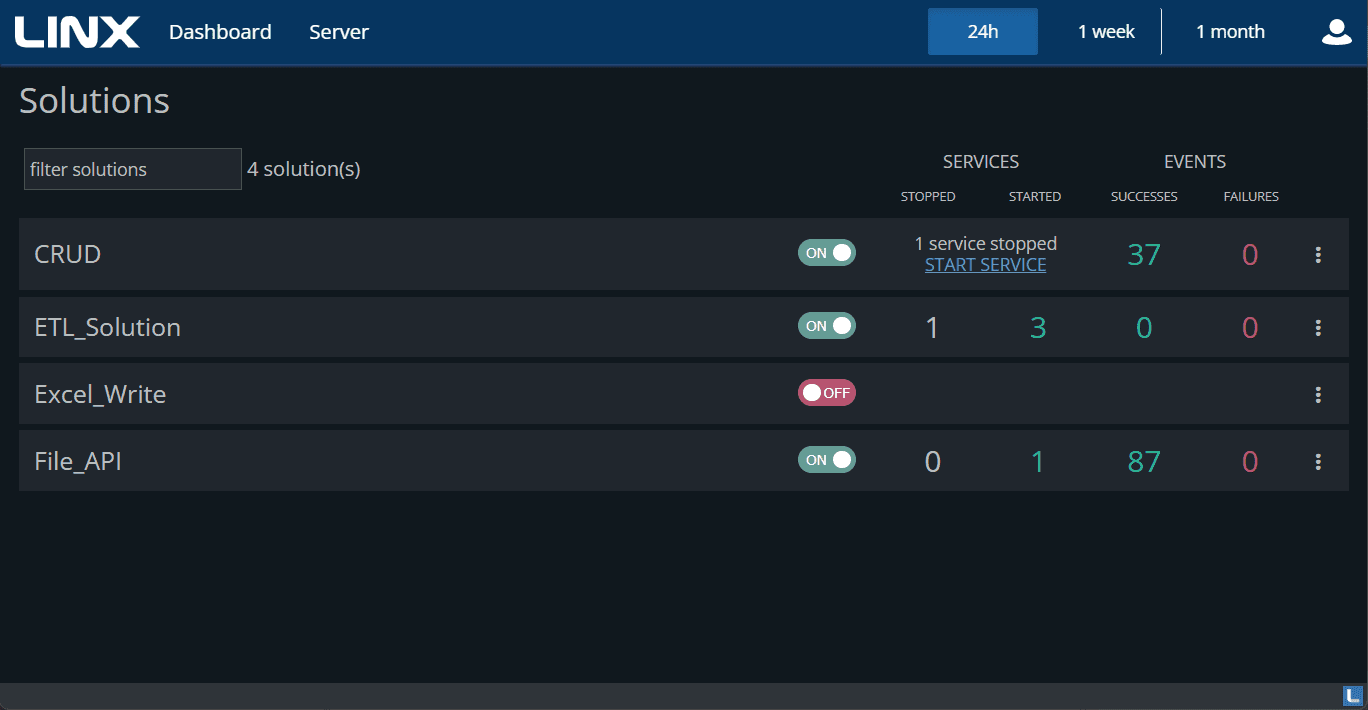
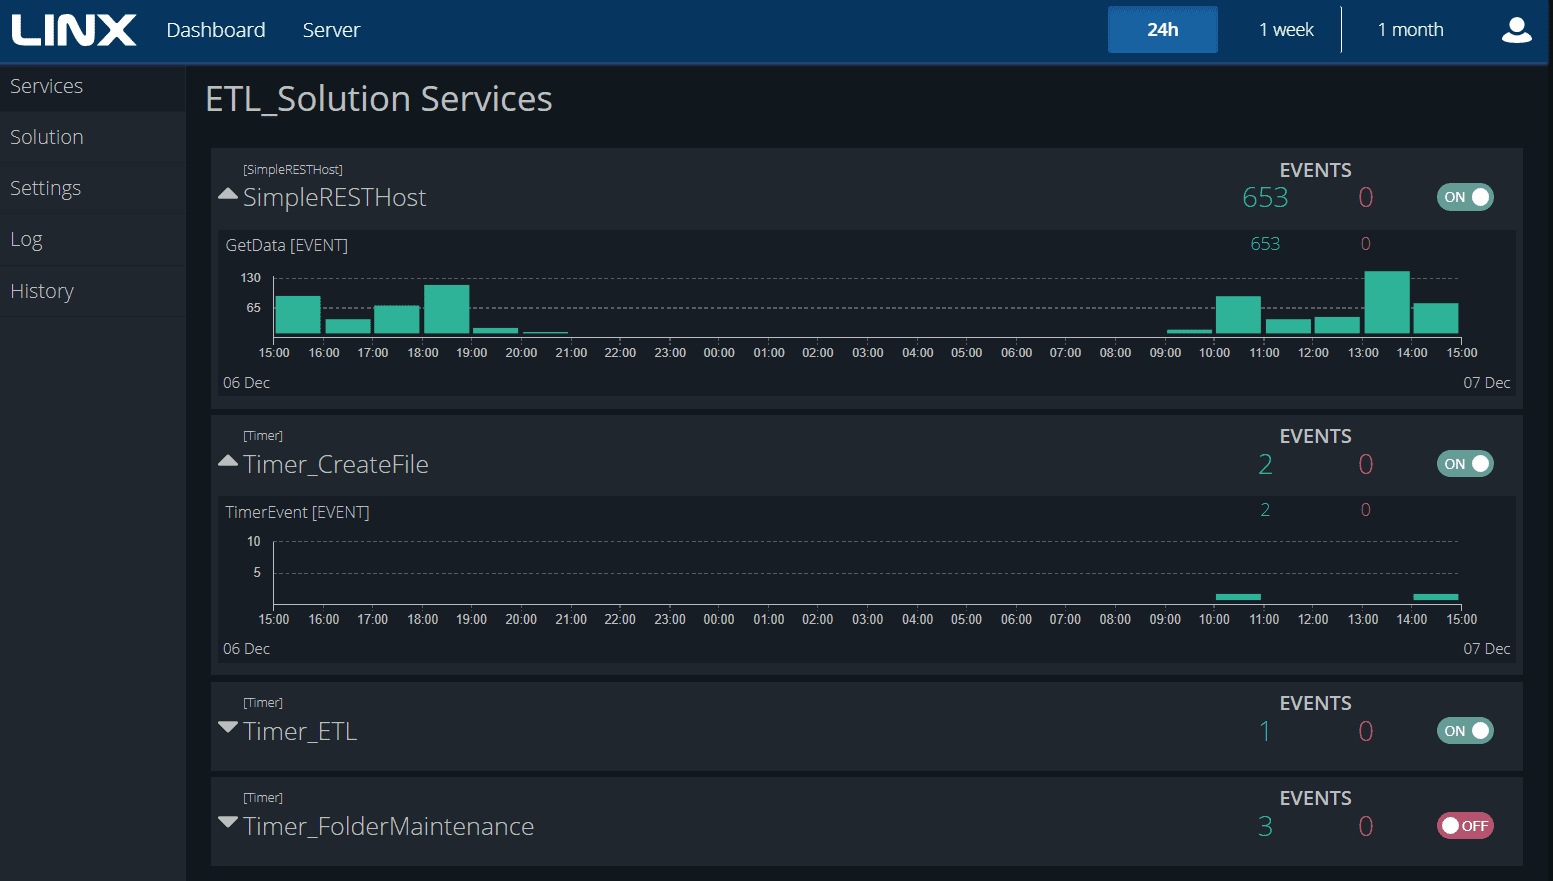
Solutions (applications created with Linx) deployed to the Linx Server are displayed in the main dashboard. You can navigate into each solution to access functionality, look at logs and statistics, turn features or events on and off, and more.

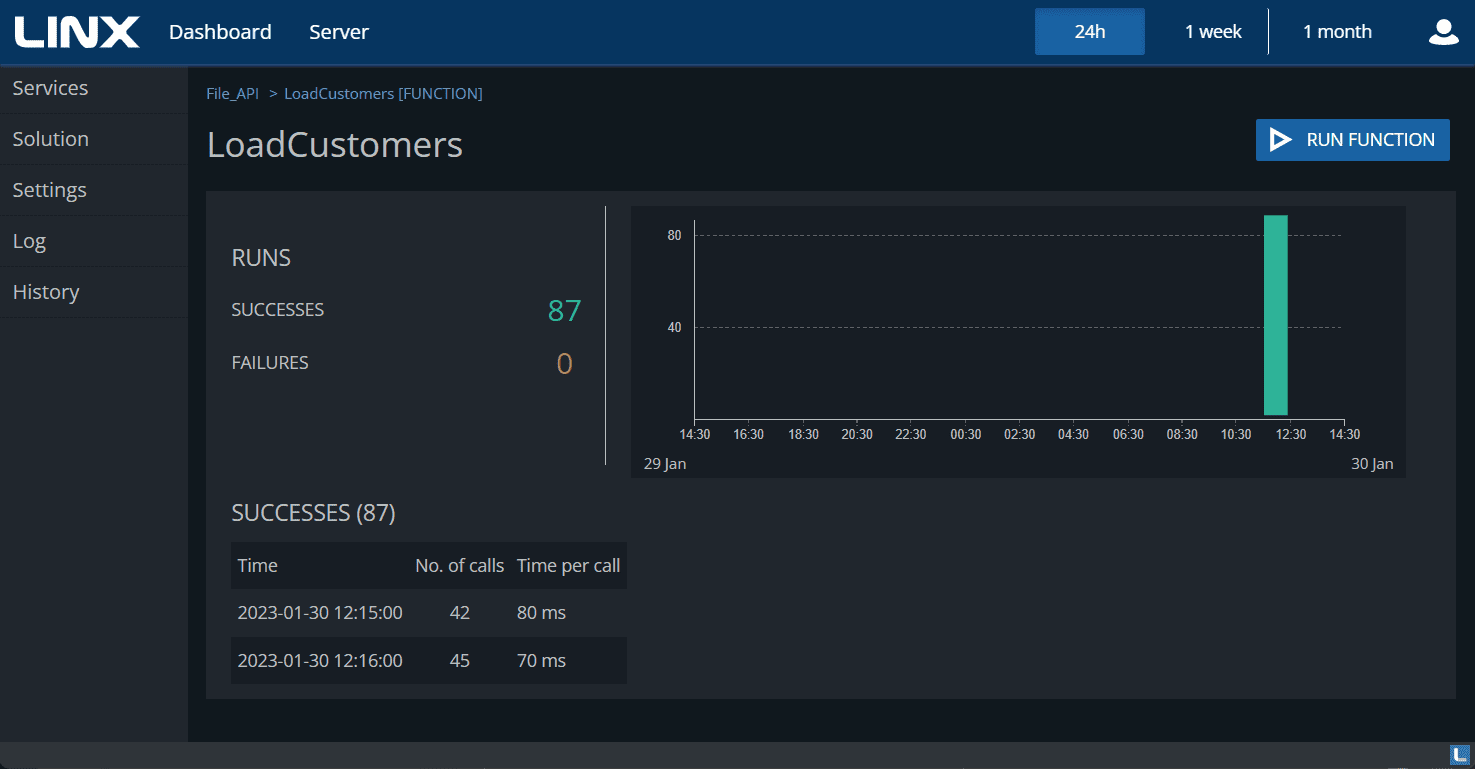
Each solution is monitored independently. You can see essential metrics on each event and function, such as how many times it has been executed, errors, and the time.

Settings
All Settings created in the Linx Designer for your solution are managed from the settings tab. Here you can reconfigure some values to meet your requirements.
For example, you created a setting for the database connection string. The server you are on is for UAT, and the connection string thus needs to connect to the UAT database. You can change this setting for the specific situation or environment. On the Production server, your settings can reflect the values relevant to that environment.
Log
The log can be configured to capture only errors or everything the server does. This gives you detailed information about an event, for example, an error which will indicate precisely where the error originated (meaning the exact function), the time and date, and the error message.
History
This tab shows when the solution was deployed (or redeployed), who deployed it, and from where (designer or directly on the server).
Deployment made easy
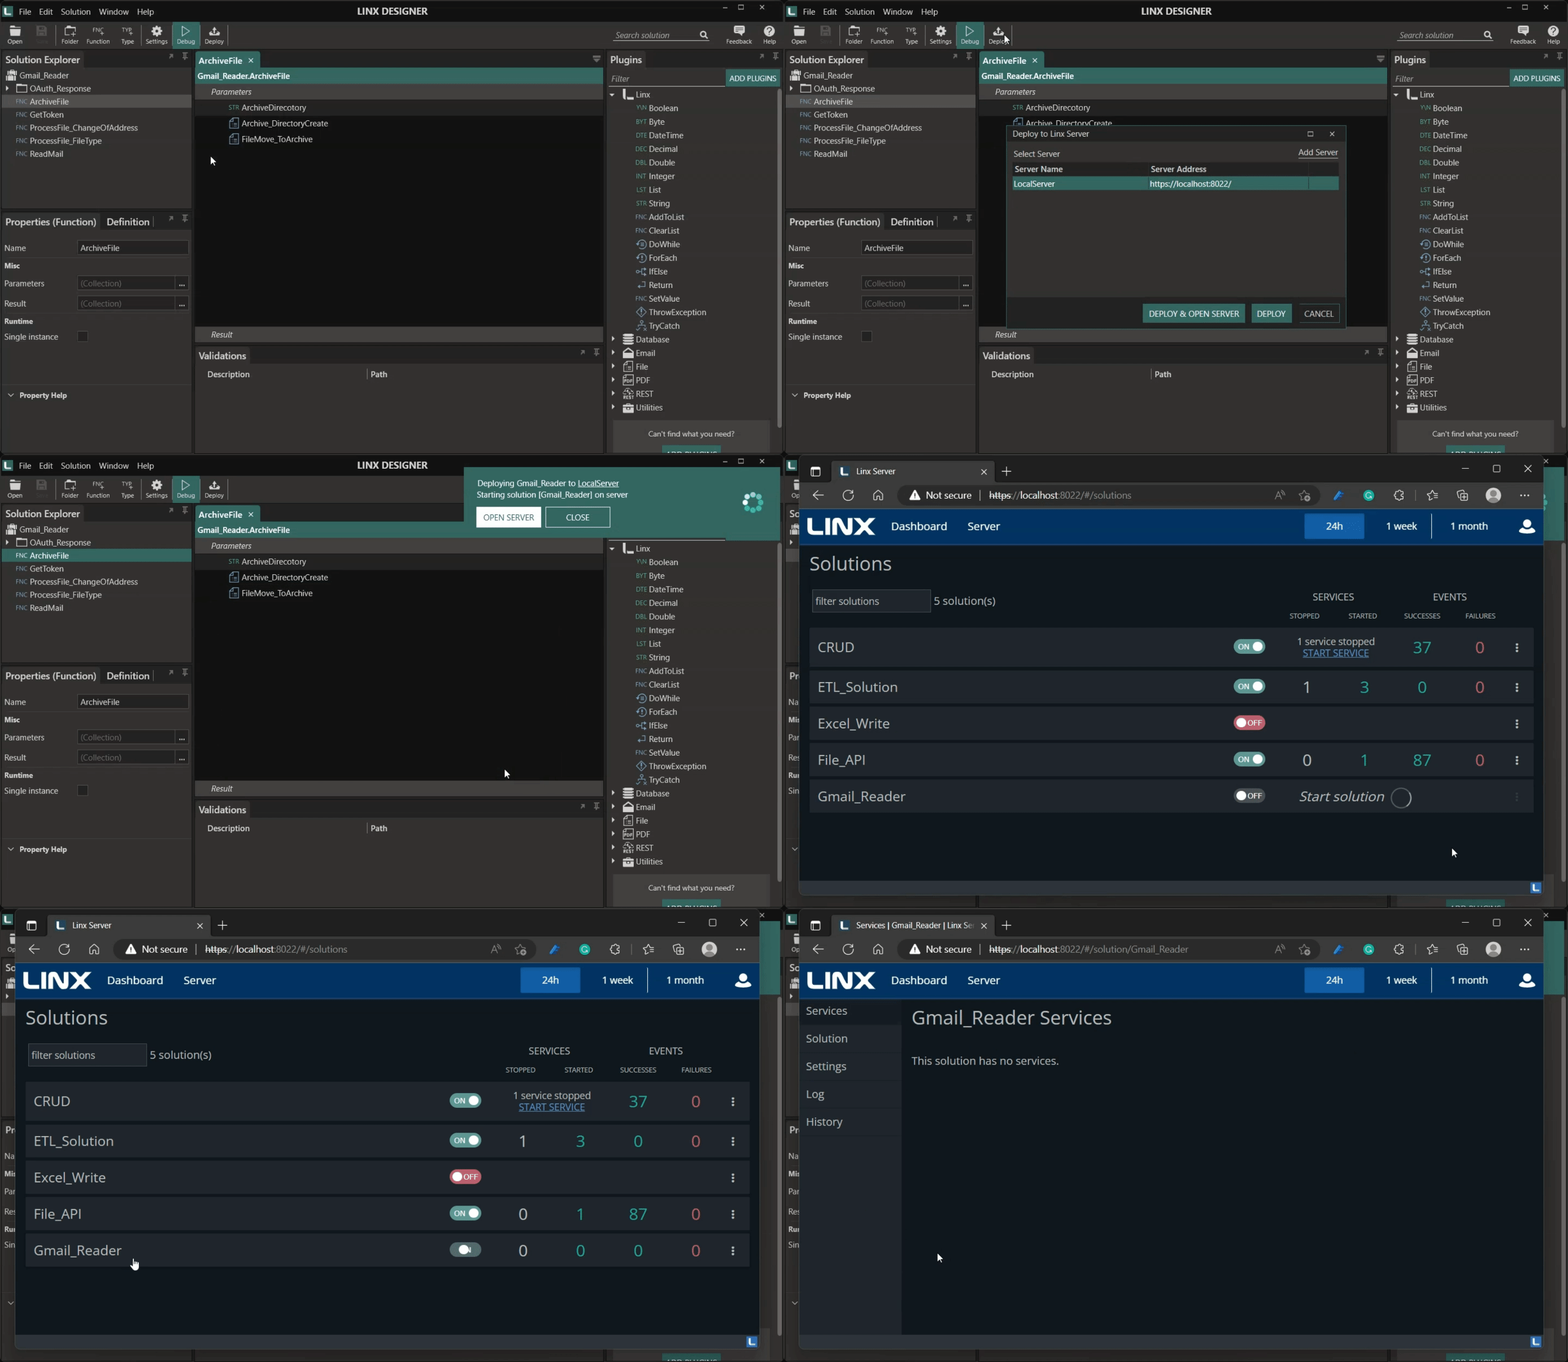
There are two main ways to deploy a solution to the Linx Server:
- From the designer, with a single click
- On the server directly
You have the flexibility to decide what deployment method to choose. Both methods are straightforward. There is no need for complex deployment pipelines. This means you and your team can move faster, getting your solution live as soon as possible.

Using built-in monitoring
Each solution is monitored individually. Captured metrics include:
- Execution metrics (When and how many times a service or function has been executed)
- Errors and exceptions

Errors can be explored in more detail in the Log tab, where you can see details such as the time, the exact function where the error originated, and the error message.

